In order to obtain access to the records, I’ve contacted the Kansas Attorney General’s office and the records Manager and Freedom of Information Office for Sedgwick county. They are unable to assist me.
This basically exhausts all the official channels. My next step is to file a lawsuit. I’ve consulted a lawyer and this is required in order to obtain permission to see the records. I’ve already left a message for my lawyer that I want to get together and get the process started.
In the meantime, a friend who had read over my website commented that all the races I had analyzed were won by Republicans. She asked if the same pattern held for Democrats. A good question, so I decided to take a look.
I pulled down the figures for the 2010 New York Governor’s race. The same pattern holds. The percent of republican votes increases with the number of votes cast in a district.
In this graph of the cummulative percent republican votes, I’ve included five different random sequences (the red and pink lines). The green line is the districts sequenced from smallest to largest while the black line is sequencing them from largest to smallest. 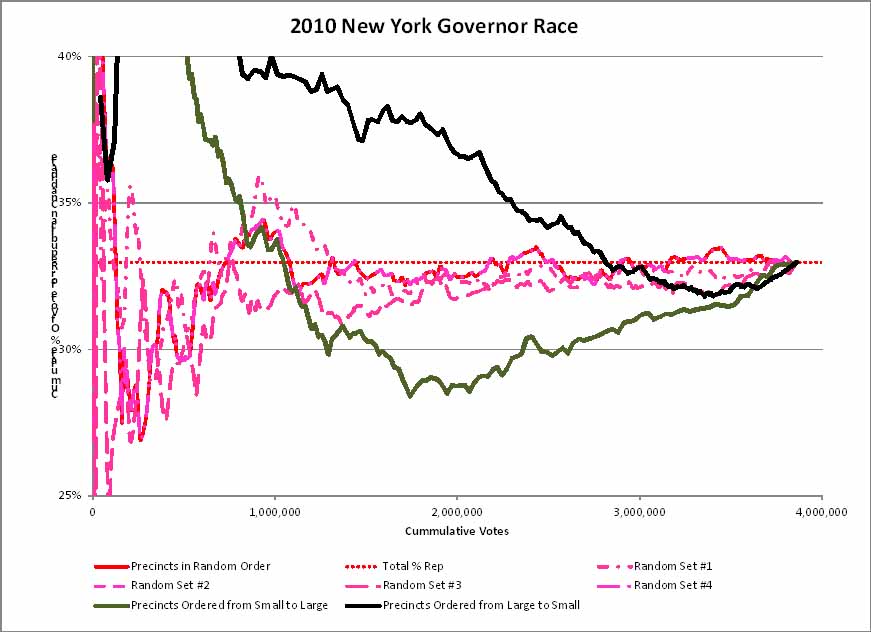
This type of analysis was described in my earlier post. The relevant point is that the lines for when districts are sequenced by the number of votes cast differ significantly from the random sequencing. This tells me that there district size correlates consistently with the percent of the vote won by the different parties.
What variable is causing that correlation is unknown, but the analysis indicates the effect is consistent across different elections in different states. The hypothesis I want to check is vote fraud due to rigging the voting machines. The only way to do that is an audit of the official records.